Custom visualizations
Earlier in the course, you created custom designs to visualize an energy consumption dataset. We have picked three of your designs for you to implement in the final assignment.
Design 1
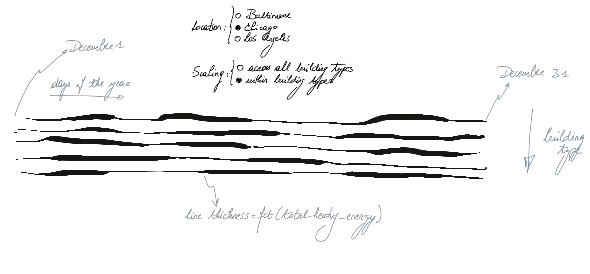
Design 1: Energy use over multiple days.
This design shows energy use over time as the thickness of a line. Each line contains hourly information for the month december. There should be a line for each building type. In addition, it should be possible to select which data is shown using two sets of radio-buttons. The first set changes which city is shown. The second set changes how the thickness of the line is scaled: per line or across all lines.
The main component for this design is located at src/routes/final_project/designs/design_1.svelte and you can load the data from /data/heating_december.json.
Before you start coding, think about how you want to structure your
visualization. Feel free to create the sub-components you need, but please use
the _design_1_*.svelte naming scheme for them.
Design 2
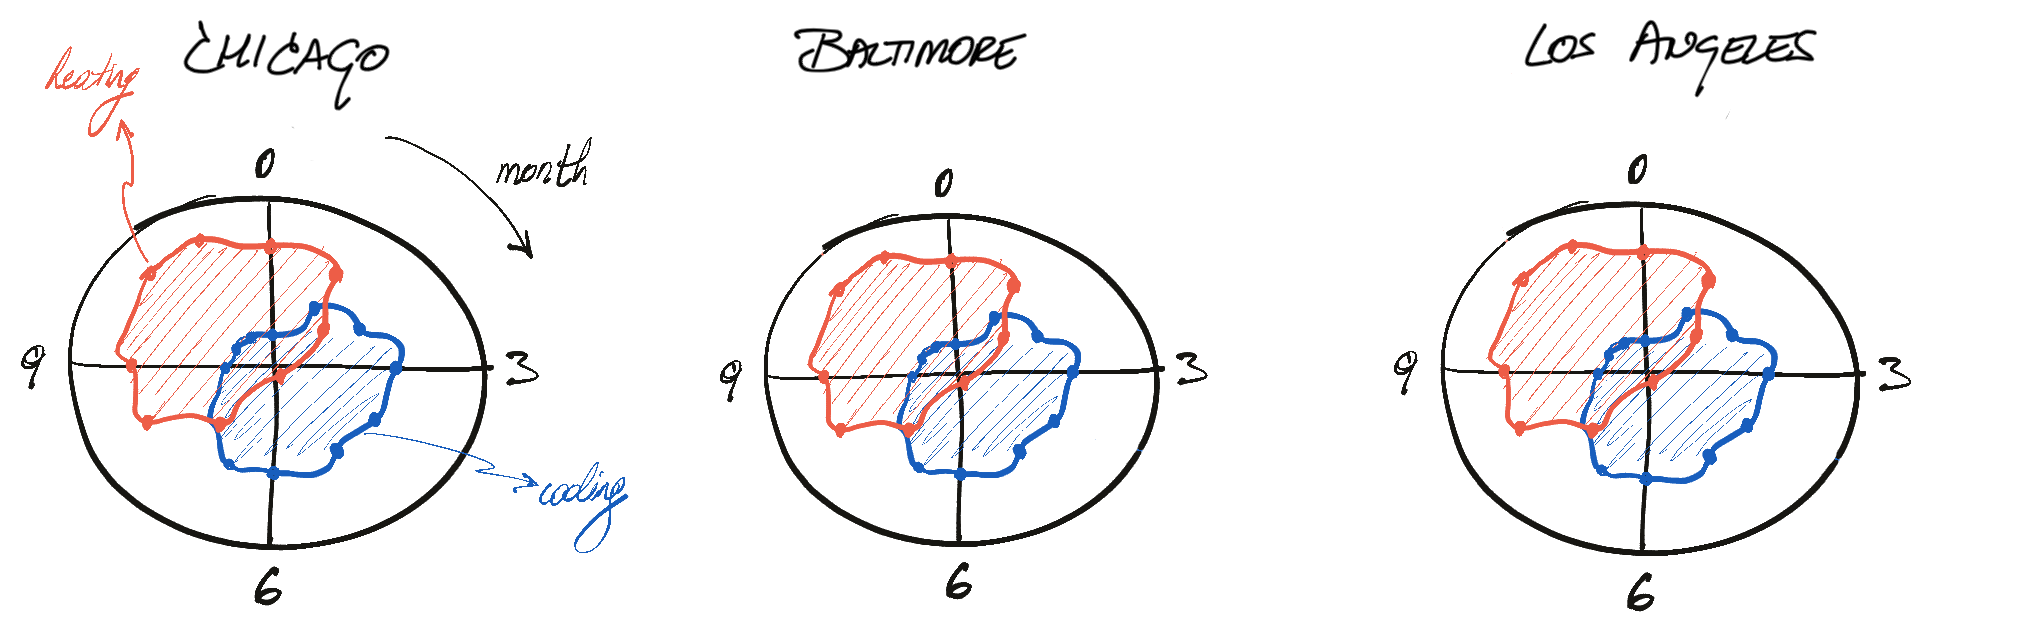
Design 2: Heating and cooling within a year.
This circular design shows the energy used for heating and cooling in a year.
Time is shown as a clock, where months behave as hours. The main component for
this design is located at src/routes/final_project/designs/design_2.svelte and you can load the data from /data/daily_heating_cooling.json. Before you start coding, think about how you want to structure your
visualization. Feel free to create the sub-components you need, but please use
the _design_2_*.svelte naming scheme for them.
Design 3
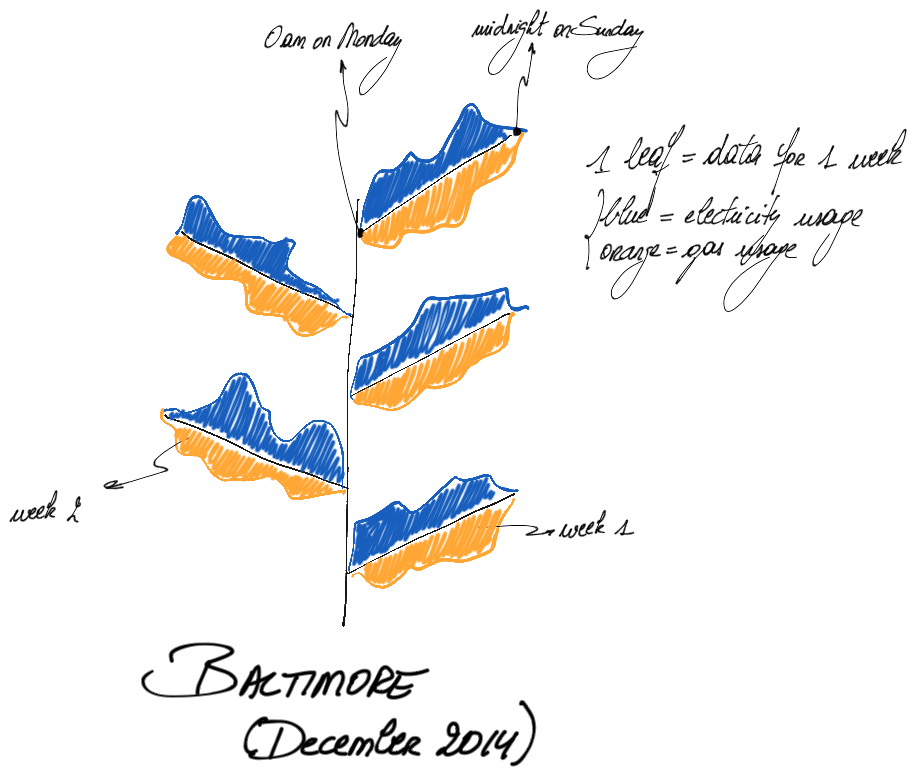
Design 3: Gas and electricity use as a tree.
This design shows the gas and electicity usage per week as leaves on a tree.
Time goes upwards and weeks are shown on alternating sides. The main component
for this design is located at src/routes/final_project/designs/design_3.svelte and you can load the data from /data/hourly_electricity_vs_gas_december.json. Before you start coding, think about how you want to structure your
visualization. Feel free to create the sub-components you need, but please use
the _design_3_*.svelte naming scheme for them.